AutoFigure Turns Text Prompts Into Scientific Diagrams
A new open-source toolkit called AutoFigure automates the creation of publication-ready scientific diagrams from text descriptions, streamlining document preparation for researchers.
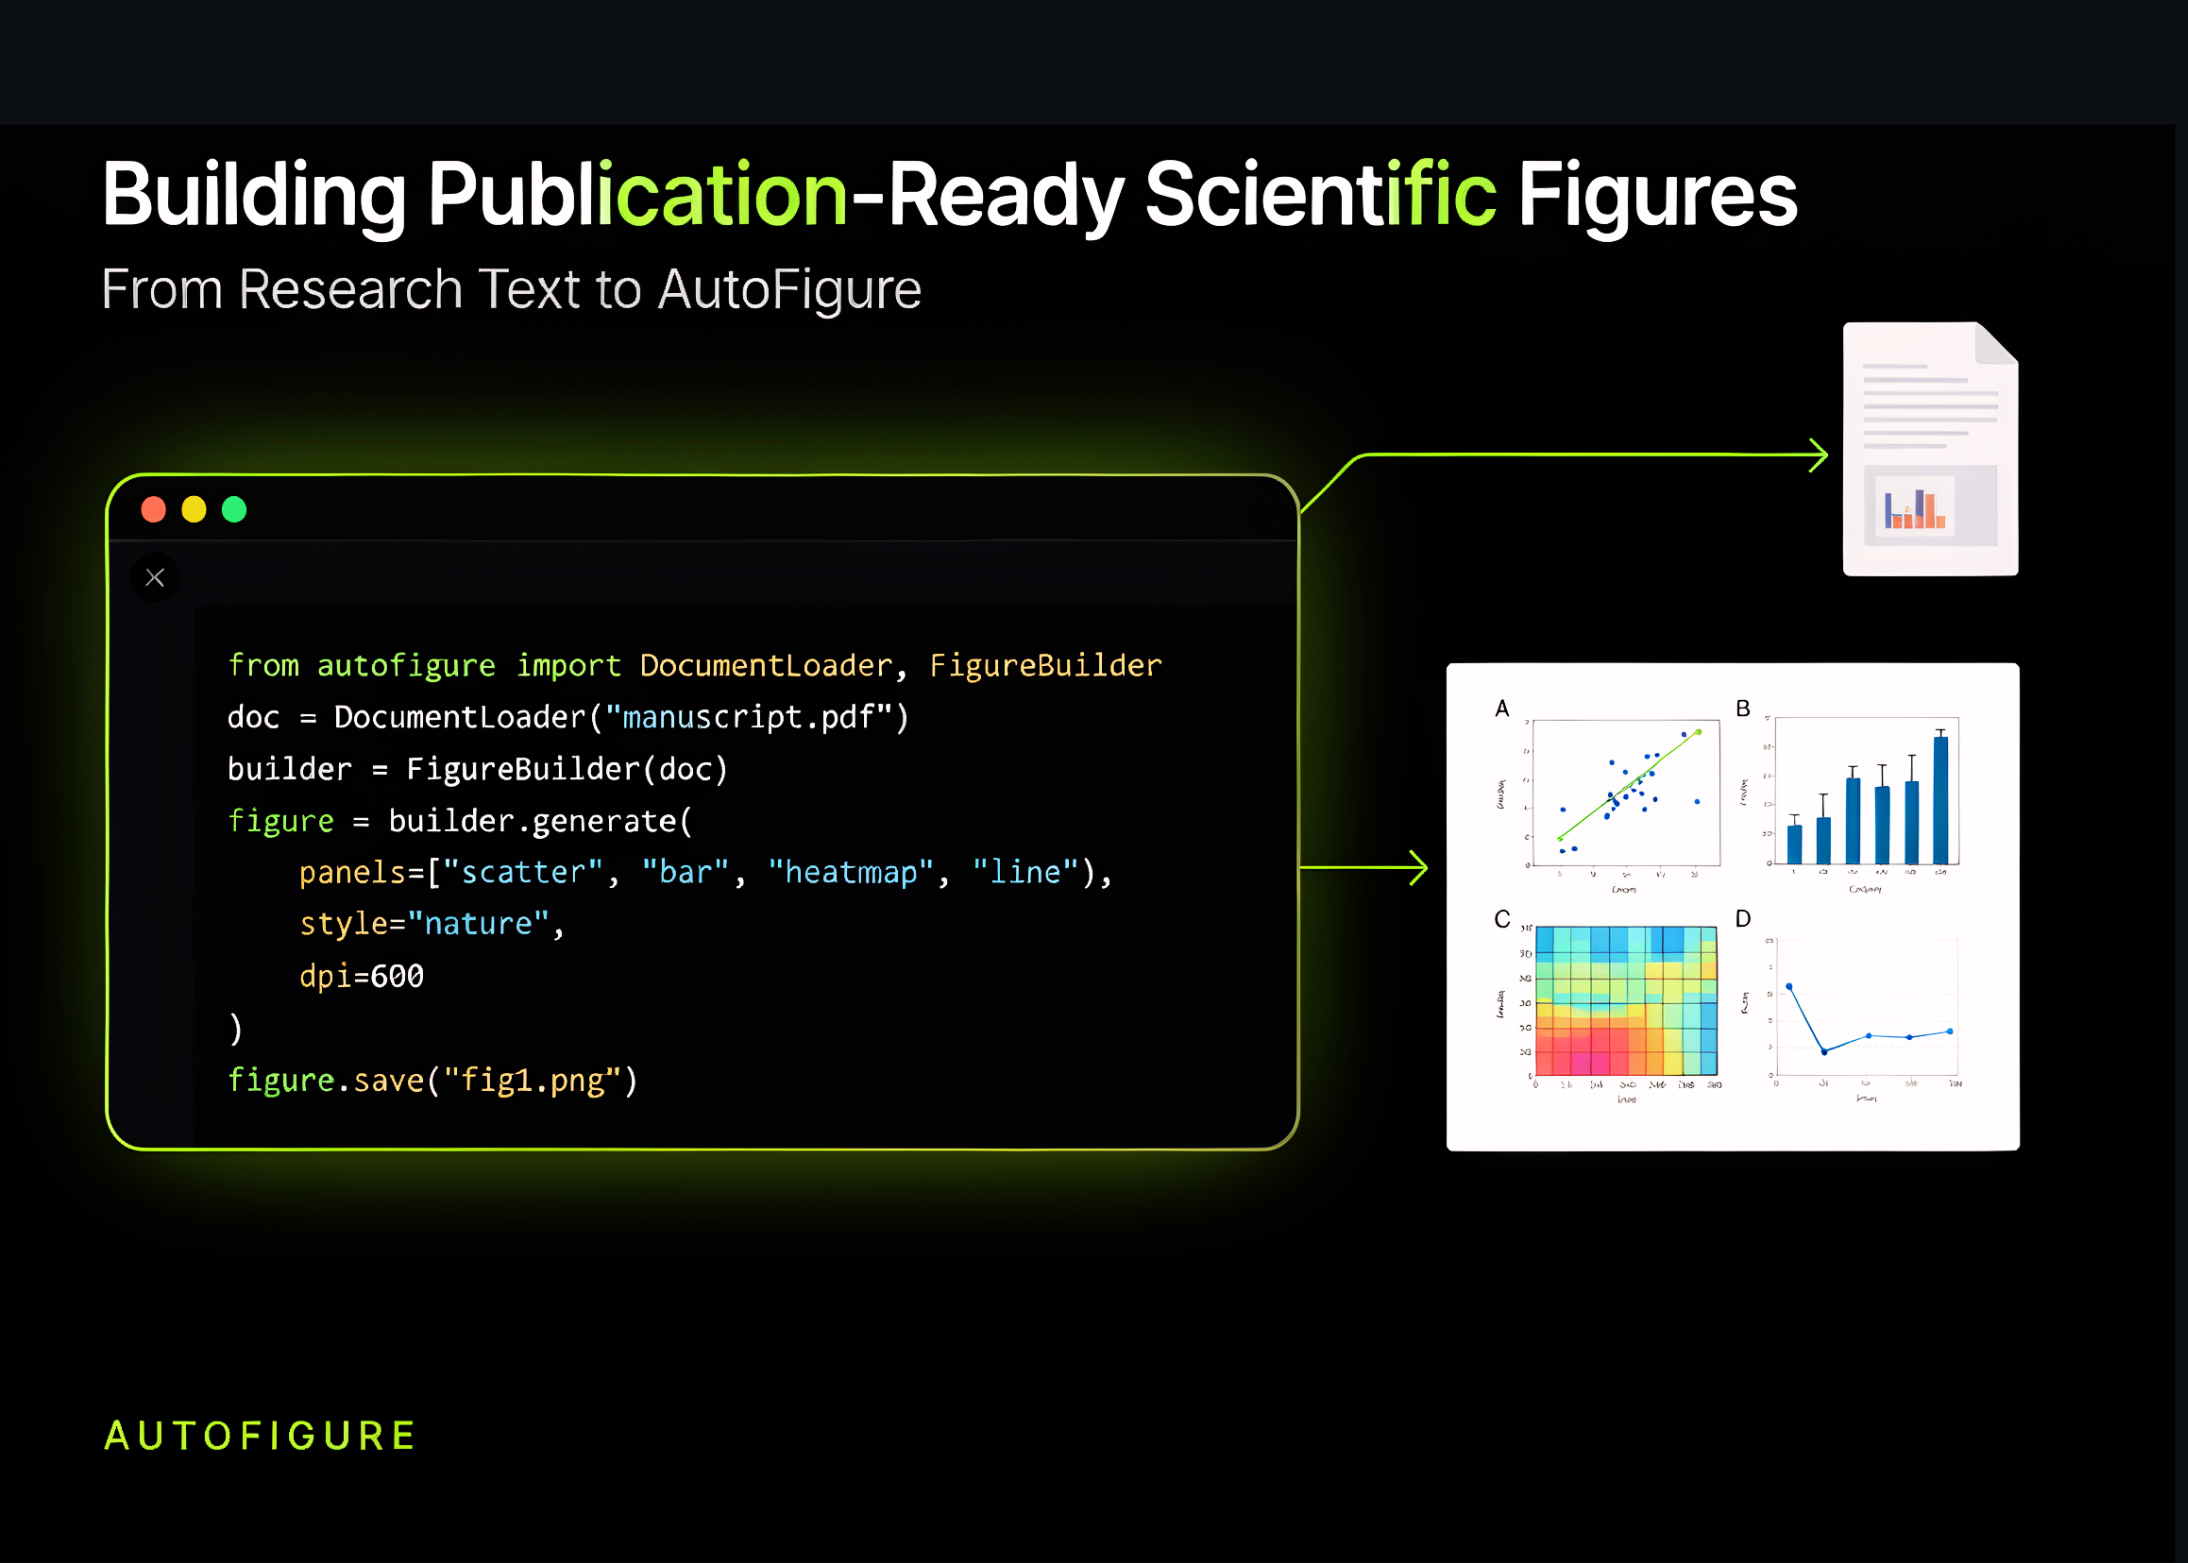
Developers have introduced AutoFigure, an open-source Python toolkit designed to automatically generate publication-ready scientific diagrams from text prompts, academic papers, and structured methodology descriptions. Hosted on GitHub, the tool allows researchers to bypass manual graphic design by converting complex pipeline descriptions directly into structured visual assets. The system supports multiple output formats, including standard PNG images, scalable vector graphics (SVG), and editable mxGraph XML files compatible with draw.io.
To power its generation and refinement loops, AutoFigure integrates with LLM providers. By default, the toolkit utilizes the google/gemini-3.1-pro-preview model via the OpenRouter API. Users can customize the generation process using specific environment variables, such as setting the maximum iteration limit to 1 and establishing a quality threshold score of 8.5. The system evaluates the generated diagrams against these metrics, utilizing a critique-and-refine loop to ensure the final output meets academic standards before exporting.
In a demonstration of its capabilities, the toolkit successfully mapped a complex seven-step agentic document intelligence pipeline into a clean, left-to-right architecture diagram. The pipeline description included document normalization, a routing planner, and five specialized expert modules: a summarizer, a table reconstructor, a visual expert, an extraction expert, and a citation tracker. AutoFigure processed this detailed methodology, incorporated a budget-aware orchestration layer and a verification layer, and produced a structured diagram complete with module boxes, directional arrows, and callouts for cost control.
Beyond basic text-to-figure generation, AutoFigure includes a methodology extractor that can parse markdown files and PDFs to draft diagrams directly from draft papers. The toolkit relies on system packages like libcairo2 and libpango for rendering, and it uses Playwright to install Chromium for mxGraph XML generation. To help users manage their outputs, the toolkit automatically compiles all generated PNGs, SVGs, and reports into an interactive HTML gallery and packages them into a single zip archive for easy export.
This is our own summary of reporting by MarkTechPost